You are using an out of date browser. It may not display this or other websites correctly.
You should upgrade or use an alternative browser.
You should upgrade or use an alternative browser.
Anyone in Surrey climbed this?
- Thread starter Beekeeper
- Start date
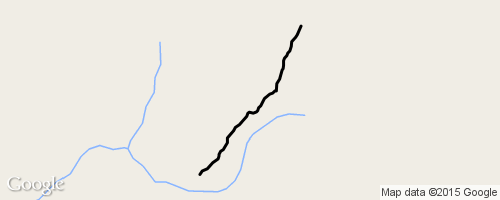
It's really hard to tell. I don't think I'd have any trouble in my custom eco (in med; standard is high). I climb rocky tom most rides (and descend it) - it took me a while to do it cleanly, but now it is pretty easy, although I'm covered in sweat. For this, once it gets steeper I go into trail (customised @ low; standard is high). Although, looking at trailforks and guesstimating where the Surrey track is (pretty close), it looks like 65m vertical within 300m horizontal (going by the contour lines)? That looks similar to what I climb (120m vertical over 682m) - not too steep; my climb is reasonably technical which is what makes it hard, whereas the surry one looks reasonably smooth.
 www.trailforks.com
I'll include the trailforks map of the box hill area - it doesn't look as though that particular track is listed.
 www.trailforks.com
Rocky Tom Drop Trail at Geilston Bay
Rocky Tom Drop is a 682 m less popular black diamond primitive trail located near Hobart. This mountain bike primary trail can be used downhill primary and has a moderate...
I'll include the trailforks map of the box hill area - it doesn't look as though that particular track is listed.
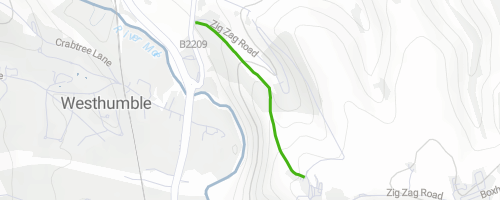
Box Hill climb Trail at Epsom
Long flinty climb to the national trust centre and viewpoint. Great challenge as a strava segment up hill.Fast descent - watch out for larger loose rocks and walkers
Last edited:
Might make a good location for climb testing videos ?
You can make @TheBikePilot run up the stairs carrying the camera at the same time - that would make interesting footage just on it's own !Might make a good location for climb testing videos ?
")
The stair set of doom on the way down looks like a nice suspension test.
If it's not got a strava name already then "Beekeepers Climb" sounds like a good one
I made a route for that path in Basecamp, and this is the elevation graph it gives:
Steeper than the Rocky Tom one above, and 2.5 times steeper than the road climb - but if it has steps you know it is steep ...

Steeper than the Rocky Tom one above, and 2.5 times steeper than the road climb - but if it has steps you know it is steep ...
Beekeeper
🍯Honey Monster🍯
- Thread starter
- #42
You can make @TheBikePilot run up the stairs carrying the camera at the same time - that would make interesting footage just on it's own !
The stair set of doom on the way down looks like a nice suspension test.
If it's not got a strava name already then "Beekeepers Climb" sounds like a good one
⛰?
Haha, The Stairway of Doom is not bad either Zim ??
Well, that puts the contour lines on trailforks way outI made a route for that path in Basecamp, and this is the elevation graph it gives:
Steeper than the Rocky Tom one above, and 2.5 times steeper than the road climb - but if it has steps you know it is steep ...
View attachment 60867
- one of them is wrong.Ah, I think I see the problem - you've misinterpreted the garmin graph? The climb starts at a height of 92m; 106m is the height of the red marker you've made on the graph.
Going by your graph it is 48m vertical over 298m horizontal. That's 17m less vertical than what I guesstimated above using contour lines from trail forks - I got the horizontal right. Rocky Tom is steeper (and more technical). It's not a dick swinging thing, just trying to get some perspective for the original question. I'm not a great rider; I do practice climbs. I think many here would climb rocky tom first go (I didn't). I think many here could do the surrey climb on a clockwork bike - I reckon I could.
Last edited:
steve_sordy
Wedding Crasher
NOOOOOOO!Well volunteered Steve ..?
I'm just genuinely curious why something so innocuous looking on a map is called an insane gradient and is so difficult to climb ..
Not me! I wasn't the one that said "'tis but a pimple!"
When it comes to climbs and descents, we all know that photos never do them justice. (Well, not the ones I take anyway).
Last edited:
Ah, I think I see the problem - you've misinterpreted the garmin graph? The climb starts at a height of 92m; 106m is the height of the red marker you've made on the graph.
I'm just looking at the grade % of Rocky Tom:
And what the the heck were them noises ?Is that even uphill?
Sod going up it, coming down would be so much more fun.
Correct. You've got the grade percentage for where that yellow spot is; just like the red spot on the other graph, that's all. It's negative because it's been recorded DOWN. It gives the other details of that spot too, that it is 339m from the start (going down from the top, because it was recorded going down), and that it (the yellow spot) is at an elevation of 151m.
That's 119m climb over 682m. The 119 is negative because it was measured going down. The grade on the other graph is for that one spot where the marker is. Just roughly 682m divided by 119 is 5.7. 298 divided by 48 is 6.2. This just shows that 119m is a bigger proportion of 682m than 48m out of 298. So rocky tom is steeper, and technical.
If you're looking at the details on the graph line itself, well again, that is for the yellow spot that only. Look at the details above the graph. And don't let the 3m climb confuse you; that just means on the way down that track there was a 3m climb. Although coming down it I don't know where that is - it's rowdy, fast and furious.
You folk are beginning to worry me
; I was terrible at maths and statistics - I hated graphs and charts
Last edited:
Correct. You've got the grade percentage for where that yellow spot is; just like the red spot on the other graph, that's all. It's negative because it's been recorded DOWN. It gives the other details of that spot too, that it is 339m from the start (going down from the top, because it was recorded going down), and that it (the yellow spot) is at an elevation of 151m.
That's 119m climb over 682m. The 119 is negative because it was measured going down. The grade on the other graph is for that one spot where the marker is. Just roughly 682m divided by 119 is 5.7. 298 divided by 48 is 6.2. This just shows that 119m is a bigger proportion of 682m than 48m out of 298. So rocky tom is steeper, and technical.
If you're looking at the details on the graph line itself, well again, that is for the yellow spot that only.
You folk are beginning to worry me
I just picked a random section around that path and looked at various points on both of them to compare ... So let me pick the central section:
With your maths applied to that it is 120m / 30m = 4 which shows this is steeper than Rocky Tom.
I've not ridden either, but it seems pretty obvious to me that Rocky Tom must be flat as a pancake in comparison - I think my blind granny could ride up it into a headwind going backwards on a unicycle ...
It's not my maths, or the same graph; I'm lostI just picked a random section around that path and looked at various points on both of them to compare ... So let me pick the central section:
View attachment 60944
With your maths applied to that it is 120m / 30m = 4 which shows this is steeper than Rocky Tom.
I've not ridden either, but it seems pretty obvious to me that Rocky Tom must be flat as a pancake in comparison - I think my blind granny could ride up it into a headwind going backwards on a unicycle ...
. Or is it that you've just picked out (randomly) the steepest part of the climb - I think that's it. Ok, yes, the steepest part of the surrey climb is from 100 to 130m - that's an amazing coincidence for a random selection. I assume you know that your green line starts at 100m elevation; so your red mark is at 10.5m vertical gain from the start of your line? I think what you're trying to show is 10.5m / 40m? I don't understand the significance of that.Now, If I picked out the steepest section of climb from rocky tom, what would we have, as a fair comparison of course? Don't think I can with trail forks.
It's cool - it has turned into a dick swinging contest, and therefore no longer useful to compare. I'm sorry for that and concede that Surrey is definitely the harder climb, by a huge factor.
Last edited:
It's not my maths, or the same graph; I'm lost
Yes I picked out the central 120m of my original graph where the steep section is - and considering it over the full length (of the new graph), not at the random highlighted point. So it shows 30m rise over 120m horizontally.
But it's still not as steep as here Baldwin Street in New Zealand reinstated as the world’s steepest street | Guinness World Records
This deffo needs to become a sticky thread where people can post videos of their thwarted attacks on the hill.
How did it go ?Week I am going to give it a crack tomorrow, stairs and all.
Be patient, he's still only halfway up!How did it go ?

Similar threads
- Replies
- 24
- Views
- 3K
EMTB Forums
Since 2018
Join Our Community
The World's largest electric mountain bike community.
- 523K
- Messages
- 25,793
- Members
Latest articles
-
The lightweight Canyon Neuron:ONfly CF is here!
Finally, Canyon is out with their first mid-assist, lightweight emtb...- Knut Nes
- 6 min read
- Views: 194
- Reaction score: 2
- Comments: 1
-
New Sight VLT and Range VLT joins the 2024 Norco lineup
How many full-power emtbs have been launched this year? Yeah, Merida...- Knut Nes
- 2 min read
- Views: 3K
- Reaction score: 2
- Comments: 2